Consumer Preferences and Attitudes Statistics
By Varun Bodhi

Understanding how consumers think has been a priority of every business to maximise all their effort. Every year, consumers are evolving based on their needs which are based on lifestyle circumstances and global events which all shape people psychologically and behaviorally.
Although a few new trends have emerged as of recent, there are several major staples which remain regardless of global changes. Here are some interesting findings based on our survey.
Professionals Still Provide Services
Covid had dramatically decreased the number of people meeting in-person with professional service providers during 2021. Although now there is a clear overall drop in the amount of people meeting in person with professional service providers in the past two years, there are clear differences by state which reflect their relative Covid restrictions.
- 66.3% of people in NSW and ACT met with a professional service provider. A significant drop prior to Covid.
- 63% of people in Western Australia visited a professional service provider.
- 57% of people in South Australia and Queensland visited a professional service provider.
- 54% of people in Victoria visited a professional service provider.
While the numbers of people visiting in person have dropped, the number of those providing services still essentially remains the same. The only major change is in how these services are provided.
Statistics on Does Business Location Matter
With the advent of home offices and working from other locations such as a café becoming prominent, a professional office is still deemed to create the most positive impact.
When deciding what impact is made upon the location in which you first meet someone, the following was found:

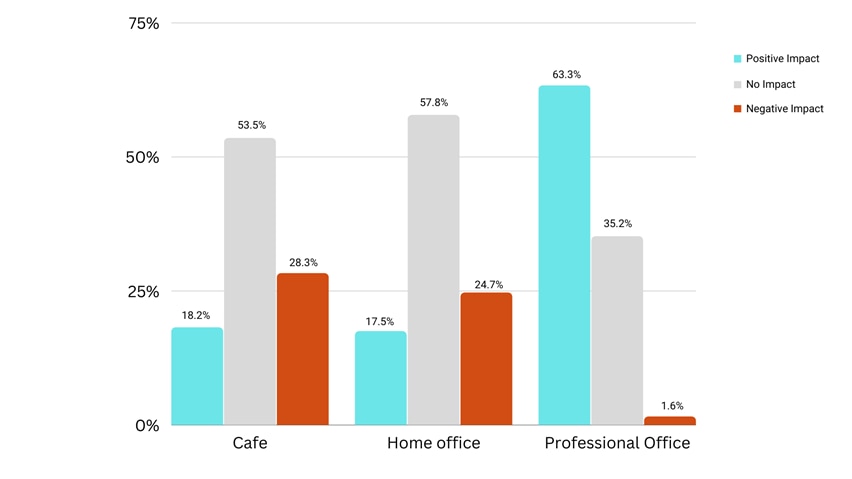
- 63.33% of people stated that meeting someone in a professional office environment had a positive impact on their purchasing/deal making decision.
- Meeting in a café creates a negative impact for 28.3% of people.
- Meeting in a home office creates a negative impact for 24.7% of people.
- People aged 55-69 were more than twice as likely to report meeting in a café as negative compared to people aged 25-34 (37.2% vs 15.3%).
- Overall, more people state that regardless of the location, no impact is made (535.5%, 57.8% & 35.2%).
Business Website Statistics
When deciding which business someone is likely to contact based on the type of address provided on a website, more than 8 in 10 would choose one with an office address.
- 45% of people would approach a business with a suburban address. Of this number, 44.6% were metro residents and 45.7% were non-metro residents.
- 37.9% of people would rather approach a business with a CBD address. Of this number, 39.3% were metro residents and 35.6% were non-metro residents
- 15.8% of people have no preference. Of this number, 15% were metro residents and 17.11% were non-metro residents.
- 1.3% of people would pick between a post office address and no address shown.
Business Point of Contact Statistics
Methods of contact including landline, mobile and email are still the preferred way to contact a business. Although reaching out to businesses via Instagram or Facebook is becoming more common, it’s still significantly behind the standard methods.
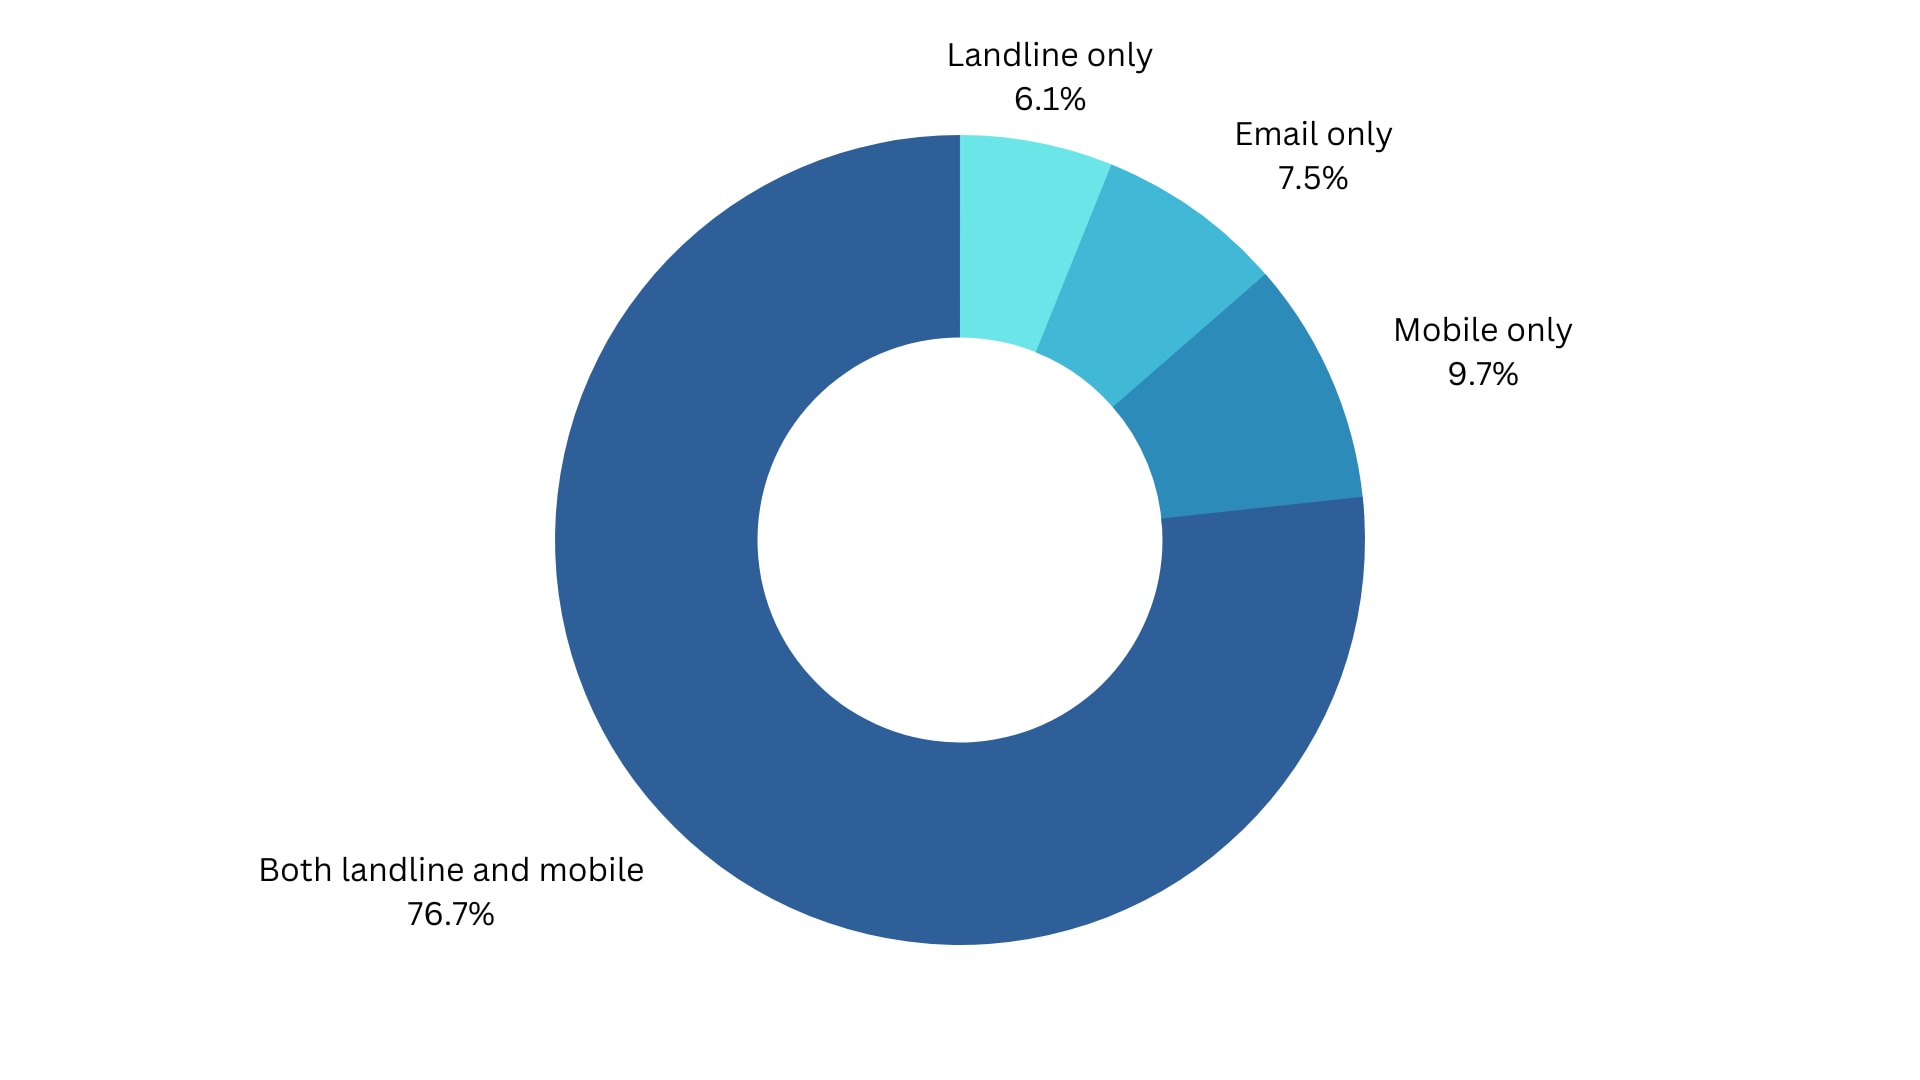
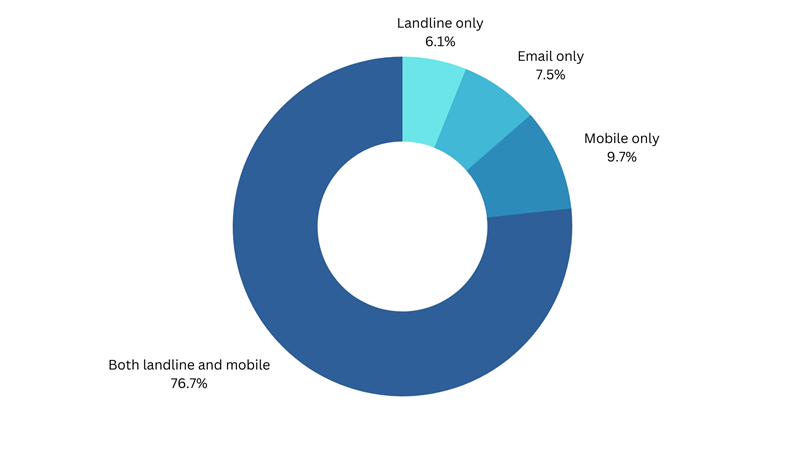
- 76.7% of people prefer a business to have both landline and mobile number listed on their website.
Landlines and Receptionists Still Matter
Potential customers are more likely to leave a message with a personal assistant or receptionist than they would with an automated message.
For calls that use an automated voicemail:
- Only 64% of people would leave a voicemail and wait for a call back.
- 29.6% of people do not leave a voicemail but they will call back.
- Only 6.5% of people do not leave a voicemail and do not call back.
For calls which are handled by a PA or receptionist:
- 81.8% of people will leave a message with a PA/receptionist and wait for a call back.
- 13.4% of people do not leave a message but will call back.
- 4.8% of people do not leave a message and do not call back.
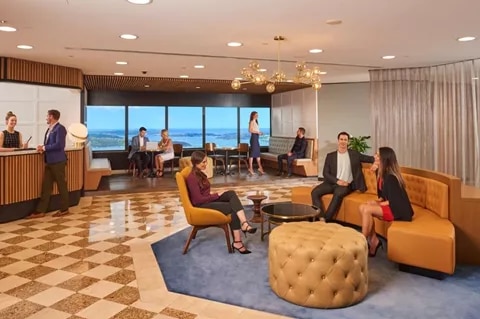
Being Greeted is Still Expected
People have become slightly more tolerant of having to attend an office that was not manned.
- Being greeted by someone on arrival created a positive impact for 92.9% of people, made no effect for 6.8% and had a negative effect for 0.3%.
- Being greeted by a professional receptionist on arrival created a positive impact for 84.7% of people, made no effect for 14.7% and had a negative effect on 0.6%.
- Having a clean office environment made a positive impact for 93.2% of people, created no effect for 7.2% and had a negative effect on 0.6%.
- If a bell or phone extension had to be rung to get customer service, 6.7% of people found this to be positive, 50.9% had no effect and 42.4% found it negative.
Recommendations are Still King
The majority of potential customers rely on either personal recommendations or online reviews when initially contacting a professional services provider.
When deciding what factors are most relevant in contacting someone:
- 92.6% of people will take personal recommendations as an important factor before reaching out to a business.
- 77.9% of people will place emphasis on the quality of the business’s website before reaching out.
- 75.9% of people will look at online reviews before contacting a business.
- 57.5% of people will check if the business of interest is in their nearest city.
Factors in Making the Final Decision
When choosing which business to purchase from, price remains as the most important factor.
The top five factors when choosing a business were:
- Fair price for 79.2% of people.
- How quickly enquiries are dealt with for 77.7% of people.
- Personal recommendations for 69.6% of people.
- The business’s expertise for 62.3% of people.
- The business’s terms and conditions for 45.7% of people.